排错工具
本章主要介绍在 Kubernetes 排错中常用的工具。
必备工具
kubectl:用于查看 Kubernetes 集群以及容器的状态,如kubectl describe pod <pod-name>journalctl:用于查看 Kubernetes 组件日志,如journalctl -u kubelet -liptables和ebtables:用于排查 Service 是否工作,如iptables -t nat -nL查看 kube-proxy 配置的 iptables 规则是否正常tcpdump:用于排查容器网络问题,如tcpdump -nn host 10.240.0.8perf:Linux 内核自带的性能分析工具,常用来排查性能问题,如 Container Isolation Gone Wrong 问题的排查
kubectl-node-shell
查看 Kubelet、CNI、kernel 等系统组件的日志需要首先 SSH 登录到 Node 上,推荐使用 kubectl-node-shell 插件而不是为每个节点分配公网 IP 地址。比如:
curl -LO https://github.com/kvaps/kubectl-node-shell/raw/master/kubectl-node_shell
chmod +x ./kubectl-node_shell
sudo mv ./kubectl-node_shell /usr/local/bin/kubectl-node_shell

kubectl node-shell <node>
journalctl -l -u kubelet
sysdig
sysdig 是一个容器排错工具,提供了开源和商业版本。对于常规排错来说,使用开源版本即可。
除了 sysdig,还可以使用其他两个辅助工具
- csysdig:与 sysdig 一起自动安装,提供了一个命令行界面
- sysdig-inspect:为 sysdig 保存的跟踪文件(如
sudo sysdig -w filename.scap)提供了一个图形界面(非实时)
安装
# on Ubuntu
curl -s https://s3.amazonaws.com/download.draios.com/DRAIOS-GPG-KEY.public | apt-key add -
curl -s -o /etc/apt/sources.list.d/draios.list http://download.draios.com/stable/deb/draios.list
apt-get update
apt-get -y install linux-headers-$(uname -r)
apt-get -y install sysdig

# on REHL
rpm --import https://s3.amazonaws.com/download.draios.com/DRAIOS-GPG-KEY.public
curl -s -o /etc/yum.repos.d/draios.repo http://download.draios.com/stable/rpm/draios.repo
rpm -i http://mirror.us.leaseweb.net/epel/6/i386/epel-release-6-8.noarch.rpm
yum -y install kernel-devel-$(uname -r)
yum -y install sysdig

# on MacOS
brew install sysdig
示例
# Refer https://www.sysdig.org/wiki/sysdig-examples/.
# View the top network connections
sudo sysdig -pc -c topconns
# View the top network connections inside the wordpress1 container
sudo sysdig -pc -c topconns container.name=wordpress1

# Show the network data exchanged with the host 192.168.0.1
sudo sysdig fd.ip=192.168.0.1
sudo sysdig -s2000 -A -c echo_fds fd.cip=192.168.0.1

# List all the incoming connections that are not served by apache.
sudo sysdig -p"%proc.name %fd.name" "evt.type=accept and proc.name!=httpd"

# View the CPU/Network/IO usage of the processes running inside the container.
sudo sysdig -pc -c topprocs_cpu container.id=2e854c4525b8
sudo sysdig -pc -c topprocs_net container.id=2e854c4525b8
sudo sysdig -pc -c topfiles_bytes container.id=2e854c4525b8

# See the files where apache spends the most time doing I/O
sudo sysdig -c topfiles_time proc.name=httpd

# Show all the interactive commands executed inside a given container.
sudo sysdig -pc -c spy_users

# Show every time a file is opened under /etc.
sudo sysdig evt.type=open and fd.name

# View the list of processes with container context
sudo csysdig -pc
更多示例和使用方法可以参考 Sysdig User Guide。
Weave Scope
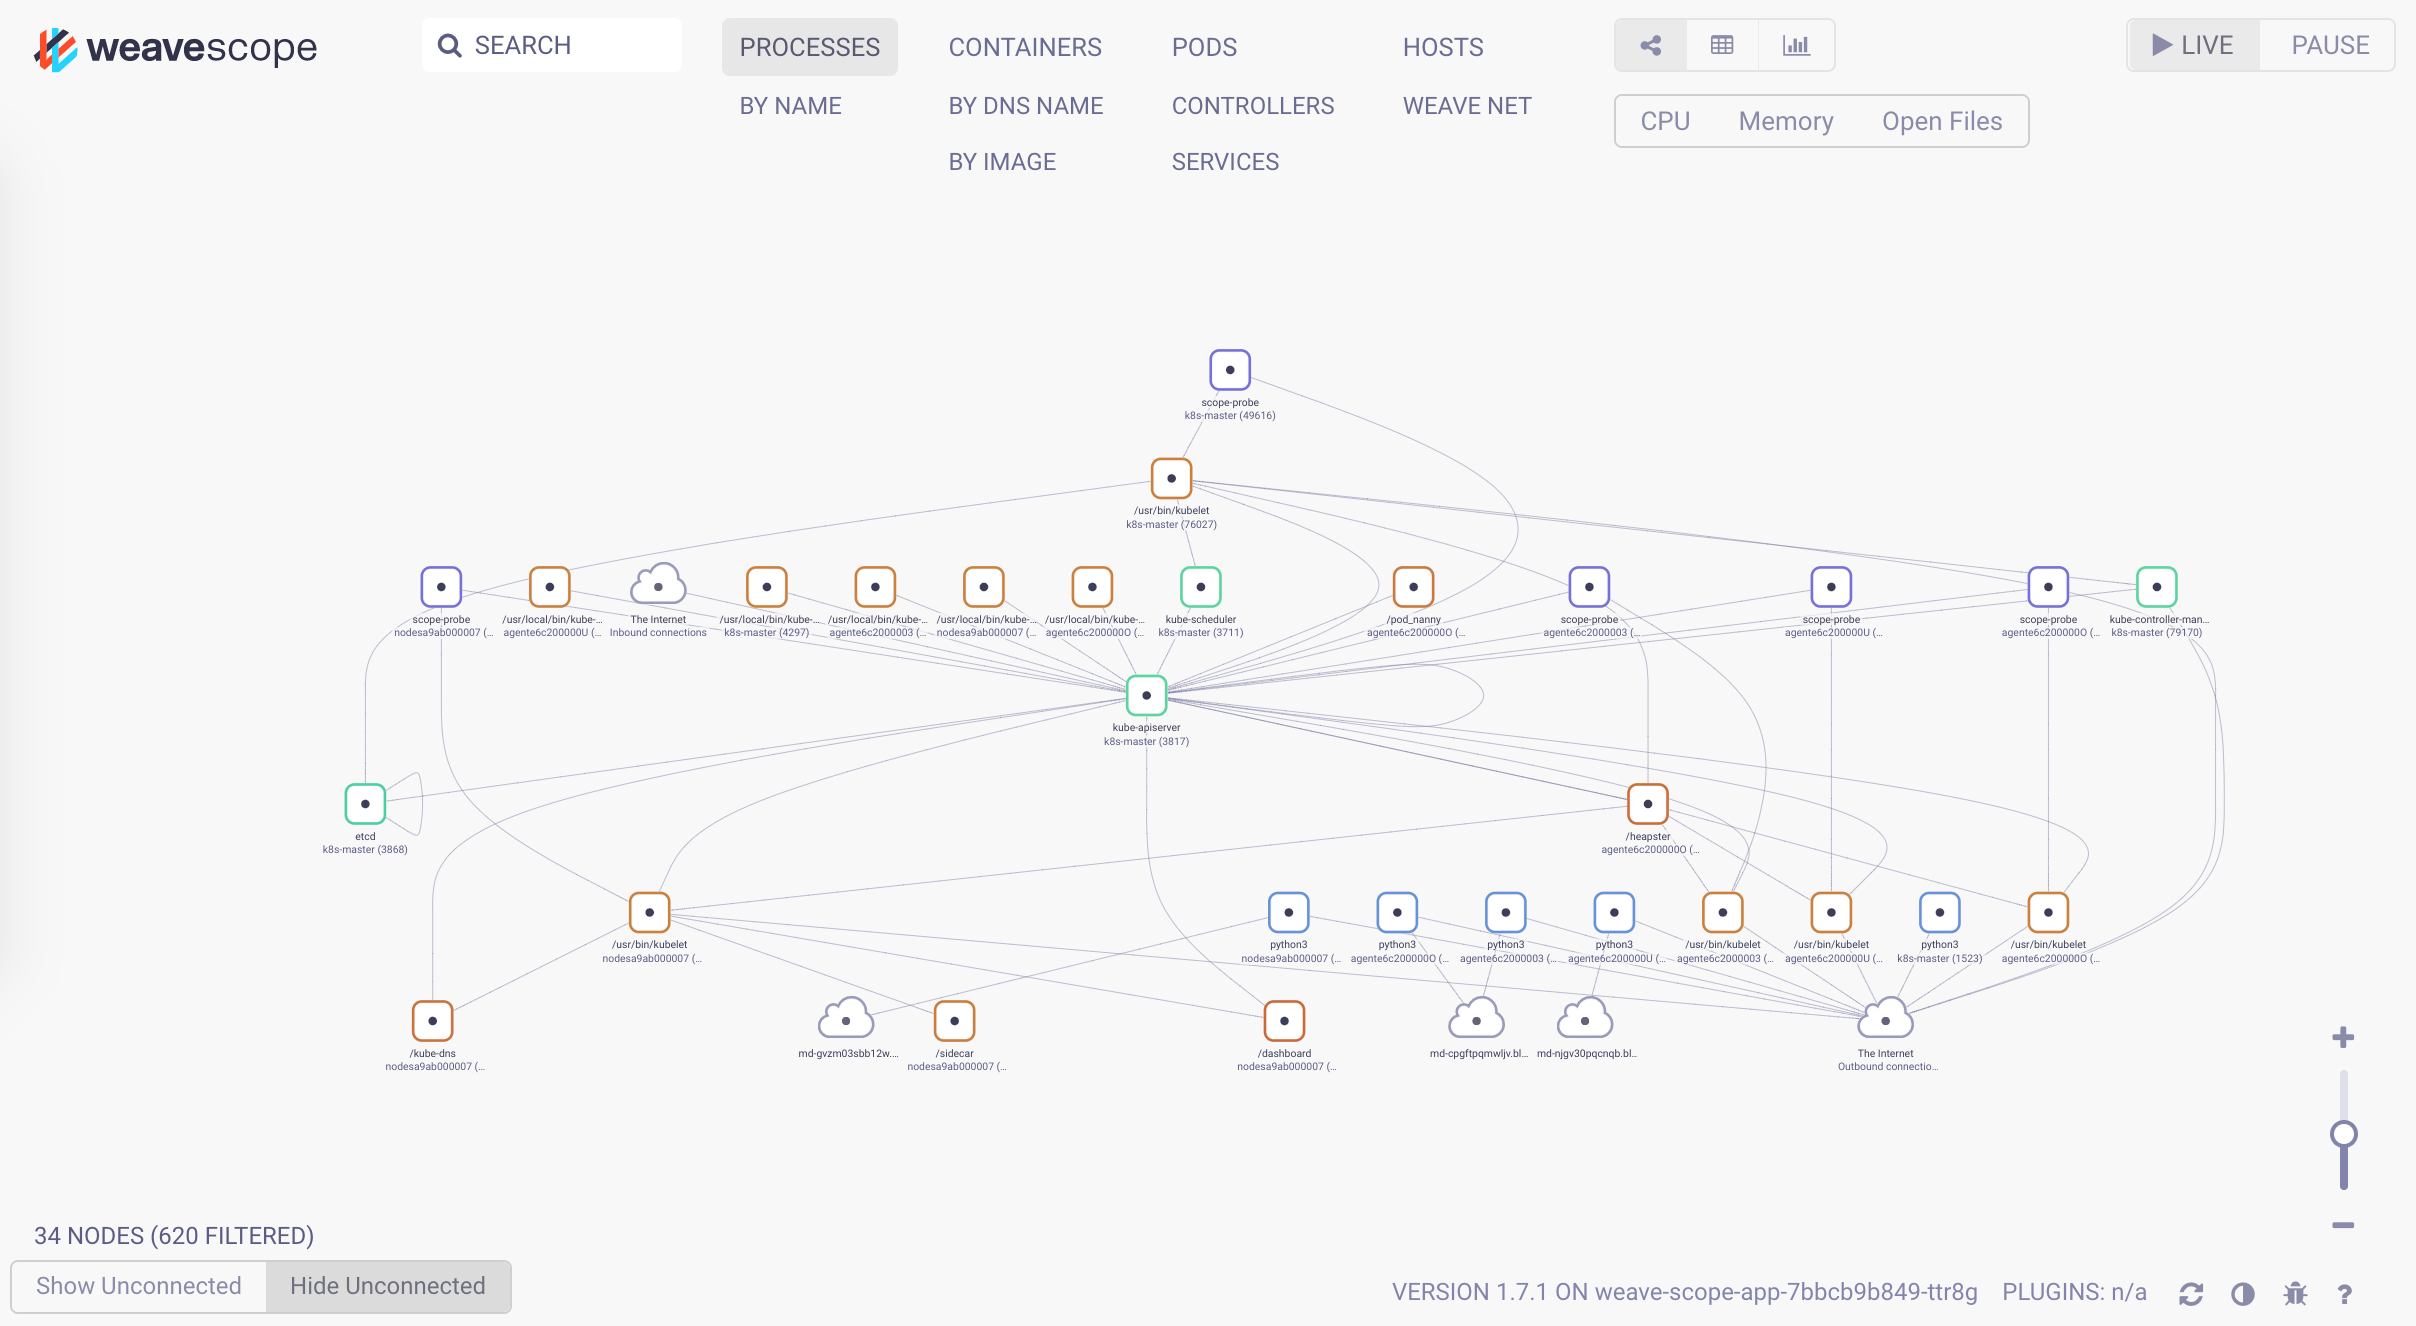
Weave Scope 是另外一款可视化容器监控和排错工具。与 sysdig 相比,它没有强大的命令行工具,但提供了一个简单易用的交互界面,自动描绘了整个集群的拓扑,并可以通过插件扩展其功能。从其官网的介绍来看,其提供的功能包括
Weave Scope 由 App 和 Probe 两部分组成,它们
- Probe 负责收集容器和宿主的信息,并发送给 App
- App 负责处理这些信息,并生成相应的报告,并以交互界面的形式展示
                    +--Docker host----------+      +--Docker host----------+
.---------------.   |  +--Container------+  |      |  +--Container------+  |
| Browser       |   |  |                 |  |      |  |                 |  |
|---------------|   |  |  +-----------+  |  |      |  |  +-----------+  |  |
|               |----->|  | scope-app |<-----.    .----->| scope-app |  |  |
|               |   |  |  +-----------+  |  | \  / |  |  +-----------+  |  |
|               |   |  |        ^        |  |  \/  |  |        ^        |  |
'---------------'   |  |        |        |  |  /\  |  |        |        |  |
                    |  | +-------------+ |  | /  \ |  | +-------------+ |  |
                    |  | | scope-probe |-----'    '-----| scope-probe | |  |
                    |  | +-------------+ |  |      |  | +-------------+ |  |
                    |  |                 |  |      |  |                 |  |
                    |  +-----------------+  |      |  +-----------------+  |
                    +-----------------------+      +-----------------------+
安装
kubectl apply -f "https://cloud.weave.works/k8s/scope.yaml?k8s-version=$(kubectl version | base64 | tr -d '\n')&k8s-service-type=LoadBalancer"
查看界面
安装完成后,可以通过 weave-scope-app 来访问交互界面
kubectl -n weave get service weave-scope-app
kubectl -n weave port-forward service/weave-scope-app :80
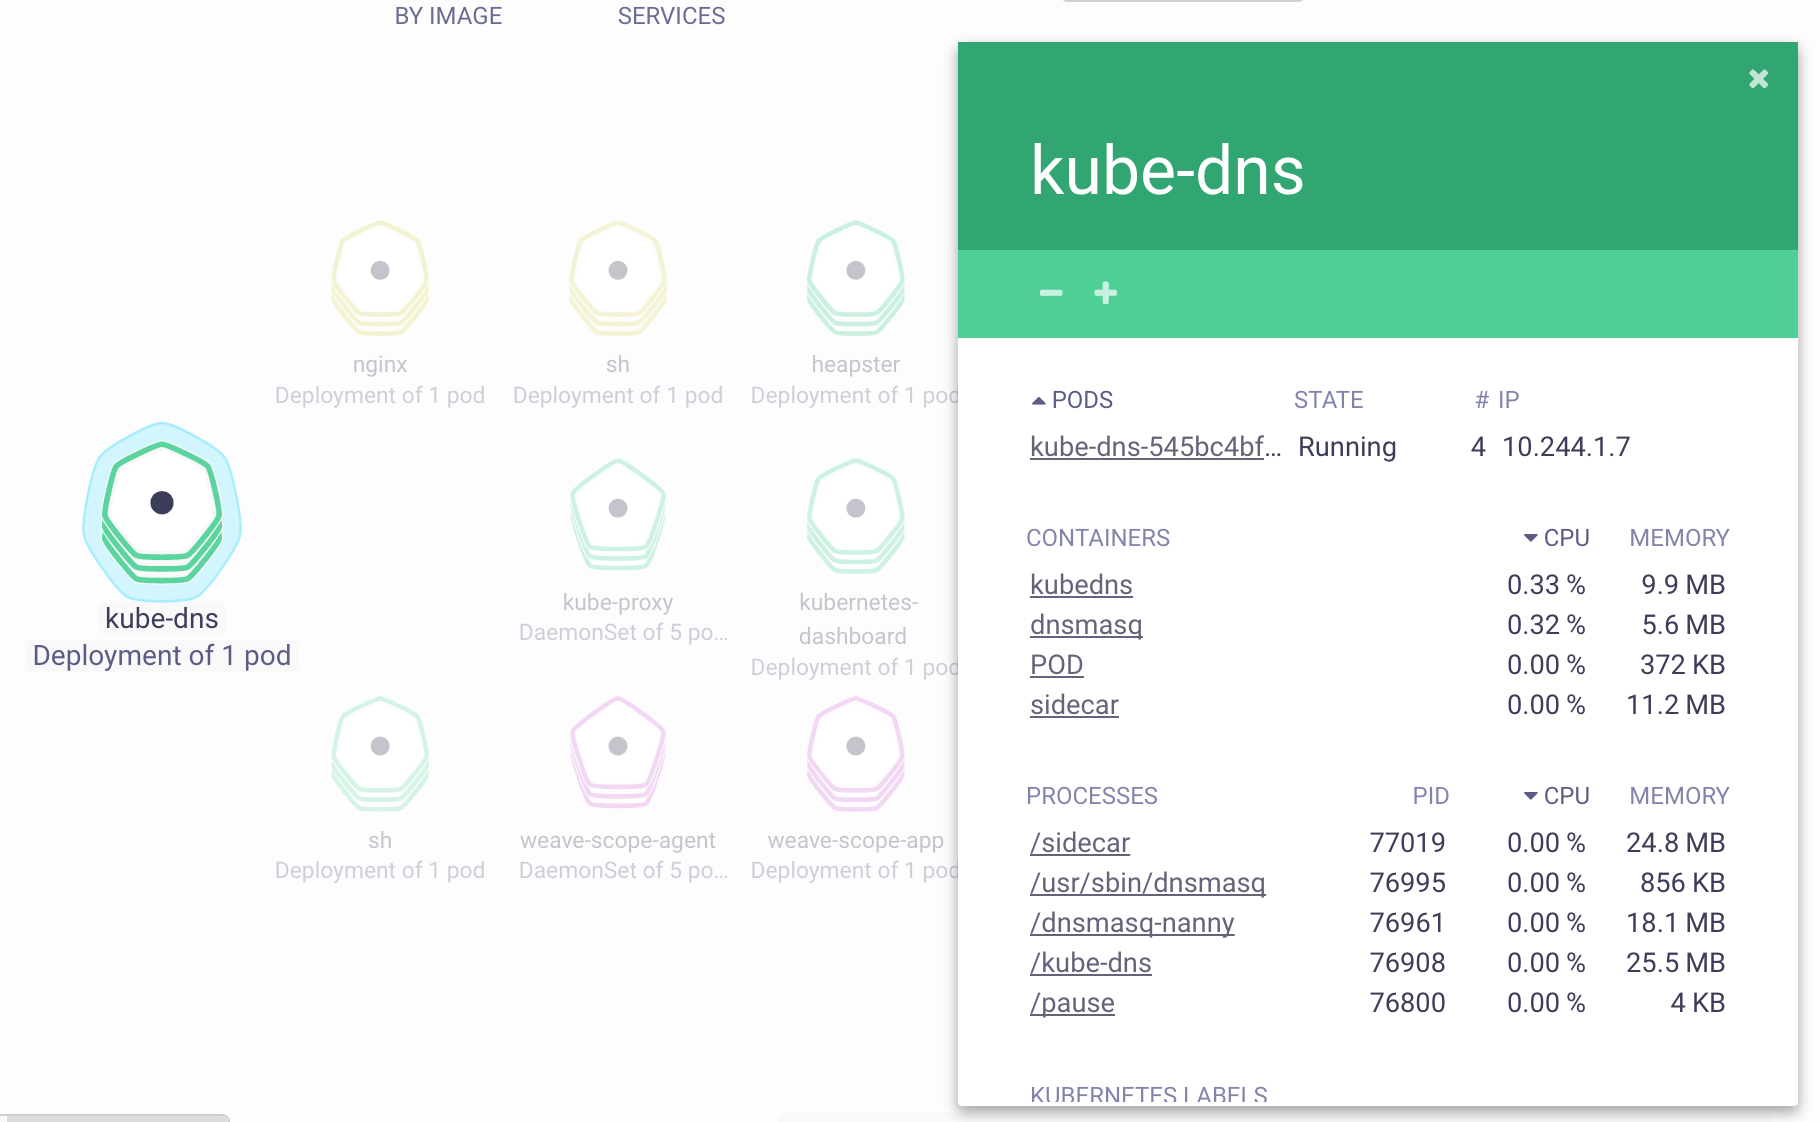
点击 Pod,还可以查看该 Pod 所有容器的实时状态和度量数据:
已知问题
在 Ubuntu 内核 4.4.0 上面开启 --probe.ebpf.connections 时(默认开启),Node 有可能会因为内核问题而不停重启:
[ 263.736006] CPU: 0 PID: 6309 Comm: scope Not tainted 4.4.0-119-generic #143-Ubuntu
[ 263.736006] Hardware name: Microsoft Corporation Virtual Machine/Virtual Machine, BIOS 090007 06/02/2017
[ 263.736006] task: ffff88011cef5400 ti: ffff88000a0e4000 task.ti: ffff88000a0e4000
[ 263.736006] RIP: 0010:[] [] bpf_map_lookup_elem+0x6/0x20
[ 263.736006] RSP: 0018:ffff88000a0e7a70 EFLAGS: 00010082
[ 263.736006] RAX: ffffffff8117cd70 RBX: ffffc90000762068 RCX: 0000000000000000
[ 263.736006] RDX: 0000000000000000 RSI: ffff88000a0e7cd8 RDI: 000000001cdee380
[ 263.736006] RBP: ffff88000a0e7cf8 R08: 0000000005080021 R09: 0000000000000000
[ 263.736006] R10: 0000000000000020 R11: ffff880159e1c700 R12: 0000000000000000
[ 263.736006] R13: ffff88011cfaf400 R14: ffff88000a0e7e38 R15: ffff88000a0f8800
[ 263.736006] FS: 00007f5b0cd79700(0000) GS:ffff88015b600000(0000) knlGS:0000000000000000
[ 263.736006] CS: 0010 DS: 0000 ES: 0000 CR0: 0000000080050033
[ 263.736006] CR2: 000000001cdee3a8 CR3: 000000011ce04000 CR4: 0000000000040670
[ 263.736006] Stack:
[ 263.736006] ffff88000a0e7cf8 ffffffff81177411 0000000000000000 00001887000018a5
[ 263.736006] 000000001cdee380 ffff88000a0e7cd8 0000000000000000 0000000000000000
[ 263.736006] 0000000005080021 ffff88000a0e7e38 0000000000000000 0000000000000046
[ 263.736006] Call Trace:
[ 263.736006] [] ? __bpf_prog_run+0x7a1/0x1360
[ 263.736006] [] ? update_curr+0x79/0x170
[ 263.736006] [] ? update_cfs_shares+0xbc/0x100
[ 263.736006] [] ? update_curr+0x79/0x170
[ 263.736006] [] ? dput+0xb8/0x230
[ 263.736006] [] ? follow_managed+0x265/0x300
[ 263.736006] [] ? kmem_cache_alloc_trace+0x1d4/0x1f0
[ 263.736006] [] ? seq_open+0x5a/0xa0
[ 263.736006] [] ? probes_open+0x33/0x100
[ 263.736006] [] ? dput+0x34/0x230
[ 263.736006] [] ? mntput+0x24/0x40
[ 263.736006] [] trace_call_bpf+0x37/0x50
[ 263.736006] [] kretprobe_perf_func+0x3d/0x250
[ 263.736006] [] ? pre_handler_kretprobe+0x135/0x1b0
[ 263.736006] [] kretprobe_dispatcher+0x3d/0x60
[ 263.736006] [] ? do_sys_open+0x1b2/0x2a0
[ 263.736006] [] ? kretprobe_trampoline_holder+0x9/0x9
[ 263.736006] [] trampoline_handler+0x133/0x210
[ 263.736006] [] ? do_sys_open+0x1b2/0x2a0
[ 263.736006] [] kretprobe_trampoline+0x25/0x57
[ 263.736006] [] ? kretprobe_trampoline_holder+0x9/0x9
[ 263.736006] [] SyS_openat+0x14/0x20
[ 263.736006] [] entry_SYSCALL_64_fastpath+0x1c/0xbb
解决方法有两种
- 禁止 eBPF 探测,如
--probe.ebpf.connections=false - 升级内核,如升级到 4.13.0